Welcome to the Optinet FLEX Training Portal. Call us on 0845 313 0233 / 01684 577 900.
 Dashboards
The Dashboard tab is similar to the Management Widgets screen, in that it shows a graphical overview of useful data involved in the management of the Practice.
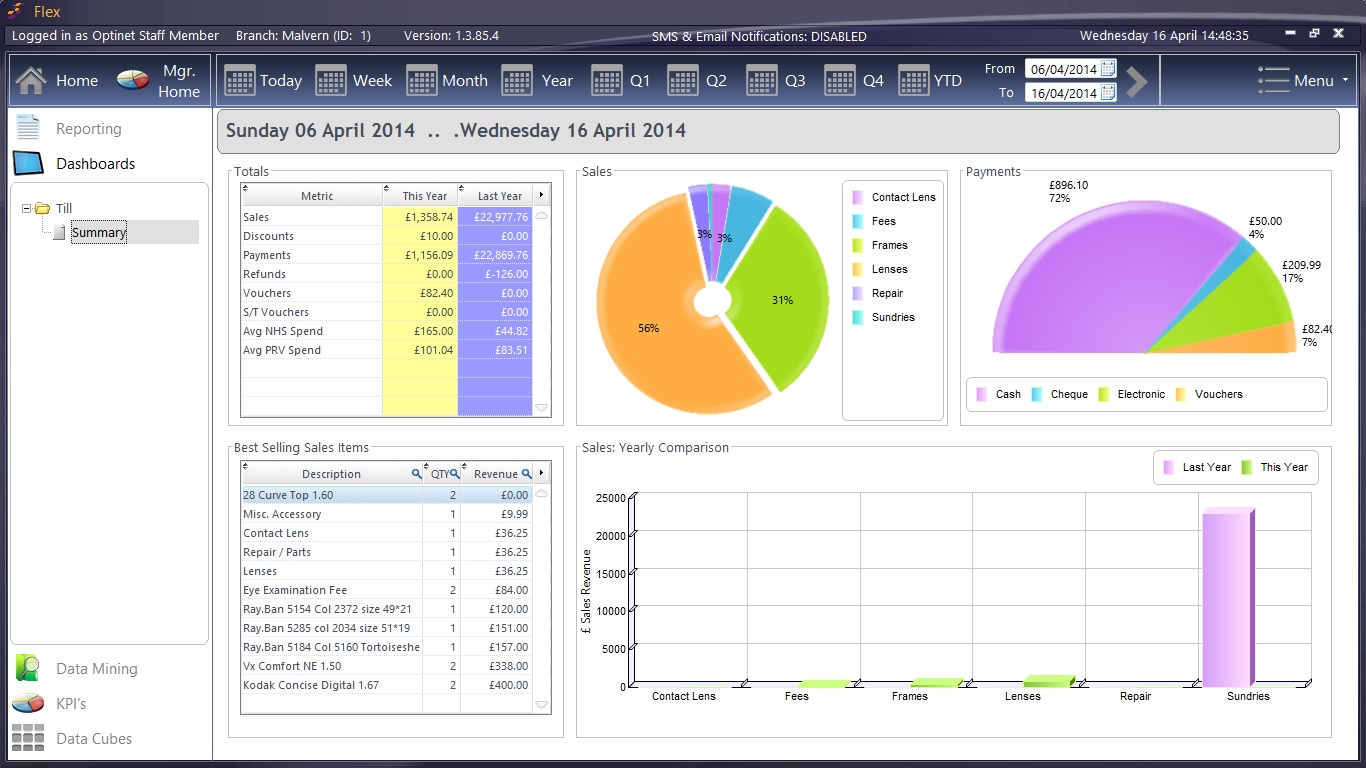
A Dashboard can be selected on the left-hand side. The screenshot below is for the Till, they are also available for every salient section of FLEX.
Management can identify well performing sectors, areas with room for growth, and also those in need of development. The Dashboard below shows us how we are performing so far this year, that the majority of our sales are lenses, cash is the main payment method and what our best selling items are.
This view can be customised to show one or all branches for Today, this Week, this Month, this Year, by Q1, Q2, Q3, Q4 or the Year to Date (YTD) - all mapped around your financial year.
A bespoke date range can also be entered. The Year to Date goes from the start of your tax / accounting year, which can be changed in the Setup