KPIs allow certain Key Performance Indicators to be viewed in the form of a chart (e.g. bar, stacked, pie...). The time-frame can be specified and these charts can then be printed or exported, for example to be emailed or analysed further.
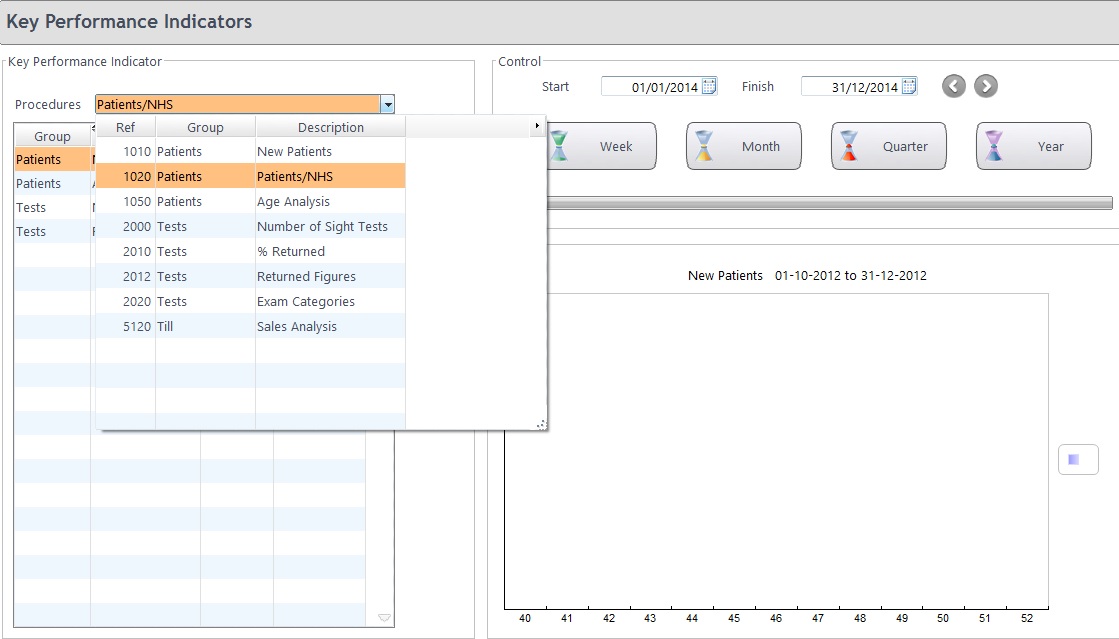
Firstly, choose the KPI you wish to explore from the list. Selections at time of writing are shown below. Press the + button to add it to your list.
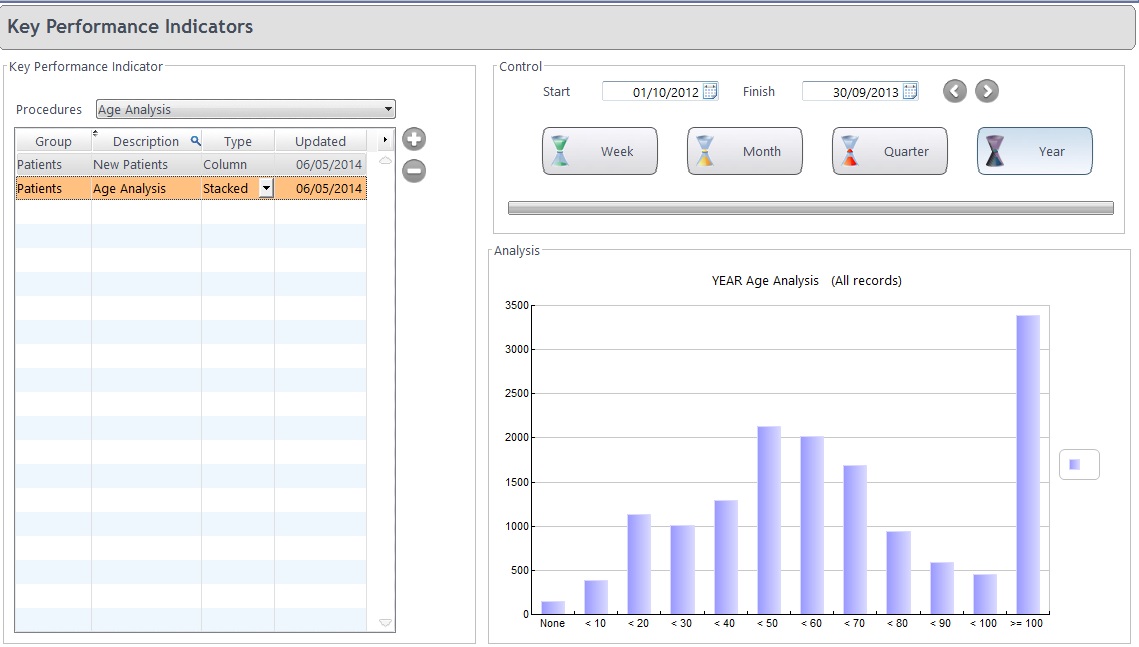
Select the type of chart required and from the Control section and click the time-frame you want to view.
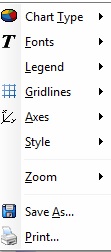
The chart then appears in the chosen format for the chosen time-frame. RIght-clicking on the chart then gives you further options.
If there are further KPIs you wish to see, please call us on 0845 313 0233.

 KPI's
KPI's